Synthetic model illustration · Systems analysis
Equipment reliability and replacement
When does planned replacement become preferable to continuing operation until failure? The answer depends on how failures develop with age and what downtime costs.
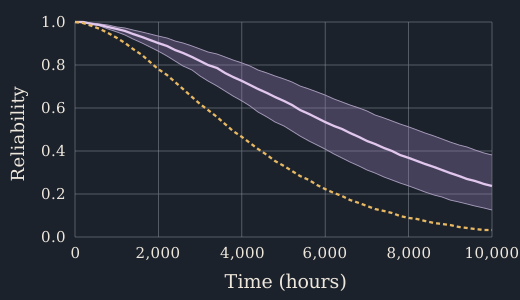
The comparison
The illustration uses Weibull survival curves with a common shape of 1.65. The solid central curve uses a scale of 8,000 operating hours. The shaded region varies the scale from 6,400 to 10,200 hours. The dashed curve uses 4,700 hours. Each curve gives the modeled probability that an item survives past a given operating time.
What the example shows
At 8,000 operating hours, the central curve gives a survival probability of about 37%. The shorter-life scenario gives about 9%. Comparing replacement intervals would also require the consequences of a failure and the cost of early replacement.
Limits
The parameters are synthetic. The shaded band shows how survival changes across the assumed scales. Applying the model to equipment would require operating histories for both failed units and units still in service.
What to measure
Link installation and removal dates to actual operating hours, failure modes, service actions, and downtime. Test whether a single failure model represents the units under consideration.
Discuss a study