Illustrative study design · Energy & thermal
Thermal system performance study
Consider a process that draws heat from a distribution loop. Would adding insulation or changing the supply temperature use less energy across the range of demand?
The comparison
Compare the existing loop with insulation and temperature-control alternatives under the same demand profiles. An energy balance follows heat from the source through the pipework to the process. Each option must still deliver the required temperature at the point of use.
What the study would examine
Long periods of low demand can make distribution losses important. A lower supply temperature can reduce those losses, but leaves less margin when demand rises. Comparing delivered heat, energy input, and temperature margin shows where the alternatives differ.
Limits
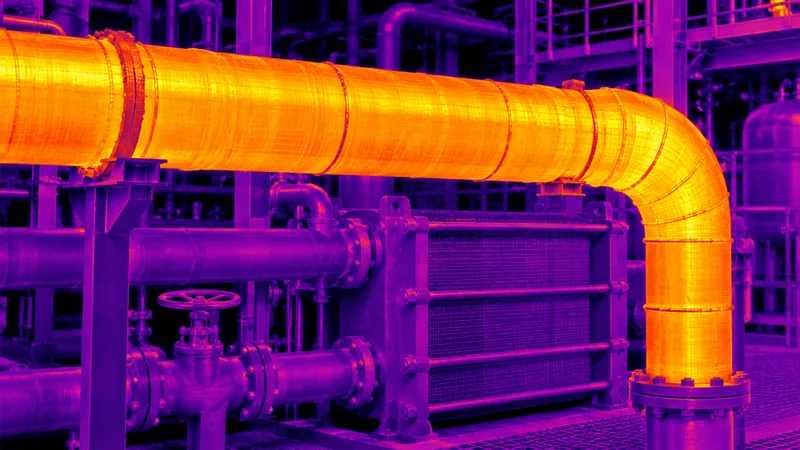
The image depicts imagined pipework. A facility-specific comparison would require pipe dimensions, insulation condition, flow rates, and operating temperatures.
What to measure
Check the baseline against synchronized flow, inlet temperature, return temperature, and energy-input measurements over both high- and low-demand periods.
Discuss a study